散点图
31 October 2017
散点图
散点图用于观察多个变量之间的关系。
使用matplotlib scatter 函数。
参考: https://matplotlib.org/api/_as_gen/matplotlib.axes.Axes.scatter.html
%matplotlib inline
import numpy as np
import matplotlib.pyplot as plt
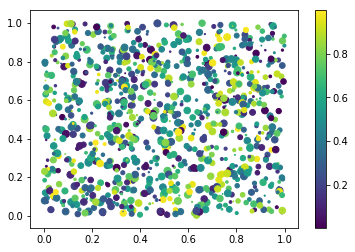
# 随机成生 1000 点数据
x = np.random.rand(1000)
y = np.random.rand(1000)
# 数据点的大小
size = np.random.rand(1000) * 50
# 数据点的颜色
color = np.random.rand(1000)
# 生成散点图
plot.scatter(x, y, size, color)
# 生成颜色状态条
plt.colorbar()
# 显示图片
plt.show()